


Temperature discrepancies: can I trust my data logger?
1. The accuracy and stability of our digital probes
All Plug and Track data loggers — whether the Thermo Button 22L, Thermo Button 21G, WeeziDot, or the digital probes (wired and wireless) used with Thermotrack PC and Thermotrack Webserve — are equipped with digital temperature sensors.
Guaranteed accuracy by model
The accuracy of our instruments varies by model. The table below summarises the guaranteed specifications:
| Product | Accuracy | Standard measurement range |
|---|---|---|
| Thermo Button 22L | ±0.5 °C | −10 °C to +85 °C |
| Thermo Button 21G | ±1 °C | −10 °C to +85 °C |
| Wired / wireless digital probes | ±0.5 °C | −10 °C to +85 °C |
| WeeziDot | ±0.5 °C | −10 °C to +85 °C |
Why “digital” makes all the difference when it comes to drift
An analogue sensor — such as a thermocouple or a low-end resistance probe — produces an electrical signal that can shift over time due to humidity, vibration, or thermal cycling. A digital sensor, by contrast, outputs a value directly encoded in binary. There is no analogue signal to interpret, which means virtually no drift over time.
Key takeaway: after years of use, a Plug and Track data logger remains just as reliable as the day it was commissioned — provided it has not suffered a serious mechanical shock or been submerged outside its rated specifications.
2. Your equipment’s display: a control tool, not a measuring instrument
The built-in display on your refrigerator, freezer, cold room, or incubator is generally not a metrological measuring instrument. Its primary function is to drive the compressor or heating element to keep the temperature within an acceptable range.
Accuracy that is often unspecified
Manufacturers of refrigeration and storage equipment rarely state the accuracy of their control probe in the user documentation. It is quite common for this accuracy to be ±1 °C to ±3 °C or worse outside the nominal range — and this is not considered a fault, because the goal is temperature stability, not precision measurement.
A position optimised for control, not for representativeness
The internal probe is positioned where the manufacturer believes it best controls the cooling system. This is typically near the air outlet, close to the evaporator, or in a very specific zone within the enclosure. That position does not necessarily represent the actual temperature experienced by stored products.
Real-world example: a pharmacy refrigerator may display +4 °C on its control panel, while the lower shelf (far from the cold air flow) is at +6 °C and the upper shelf is at +2 °C. This is precisely where continuous monitoring with an independent data logger proves its worth.
No metrological traceability
The control probe in a piece of equipment is never supplied with a calibration certificate. Its readings cannot be traced back to a national standard. In the context of a HACCP inspection, a pharmaceutical audit, or a quality review, only readings from a calibrated, traceable instrument are accepted as documentary evidence.
3. Response times and measurement frequency
Even if two instruments are perfectly accurate and positioned in exactly the same spot, they can display different readings at any given moment — simply because they do not perceive temperature changes at the same rate.
Thermal response time
Response time is the delay before a sensor’s reading reflects a change in the surrounding temperature. It depends on the sensor’s mass, its housing, and its thermal contact with the air or medium being measured.
Our data loggers have a response time of approximately 2 minutes in free air (depending on convection conditions and the model’s housing). The equipment’s control probe may respond in a matter of seconds if it is metal and in direct contact with the air flow — or much more slowly if it is embedded in a large thermal mass.
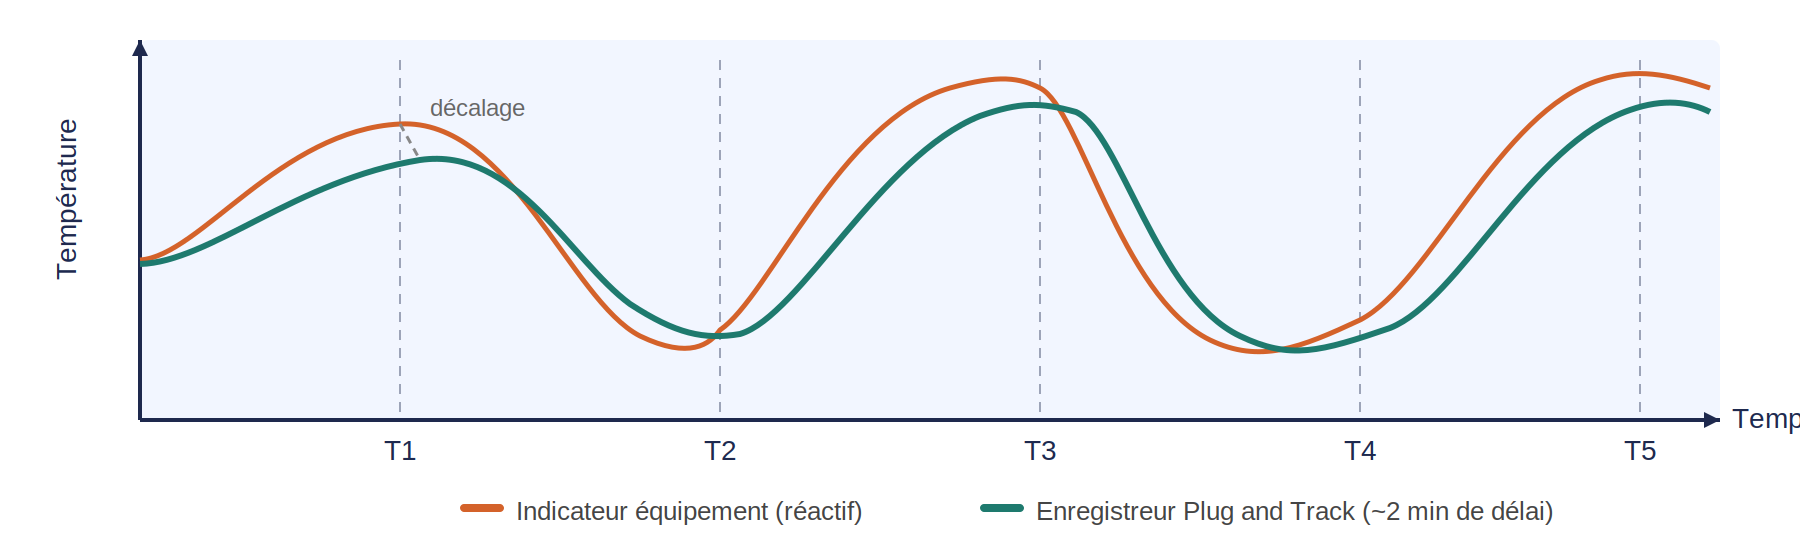
Practical consequence: if your equipment has just completed a defrost cycle or the door has recently been opened, the display may already be showing a value close to the set point, while your data logger — being more thermally inert — still reflects the disturbance. That is not an error; it is physics.
Measurement frequency
An equipment display typically refreshes every second or every few seconds. Our data loggers, in standard mode, record a measurement every 5, 10, or 15 minutes depending on the configuration. If a thermal disturbance occurs between two measurements, the data logger will not capture it — which can create an apparent discrepancy at any given instant.
| Parameter | Equipment display | Plug and Track data logger |
|---|---|---|
| Response time | A few seconds (variable) | ~2 minutes (free air) |
| Refresh rate | Continuous (every few seconds) | Configurable (5 min to 1 hr) |
| Accuracy | Not guaranteed (typically ±1 to ±3 °C) | ±0.5 °C or ±1 °C depending on model |
| Metrological traceability | None | Optional (ISO 17025 certificate) |
| Long-term drift | Possible (uncontrolled) | Negligible (digital sensor) |
4. The effect of temperature fluctuations during comparison
Comparing two instruments inside an enclosure whose temperature is not yet stable is one of the most common mistakes — and one of the most misleading. Even perfectly accurate instruments that are correctly positioned can show very different readings if the temperature is rising or falling at the moment of comparison.
Why fluctuations widen the gap
When the temperature is changing, the two instruments do not track it at the same pace. The equipment’s display or control probe, being highly responsive, picks up the change almost immediately. Your Thermo Button or digital probe, with its roughly 2-minute response time, lags behind. At any given moment T, the two devices are effectively measuring two different thermal states of the same enclosure — and the displayed discrepancy is not a measurement error, but a direct consequence of their different response rates.
This is precisely what the graph in the previous section illustrates: at instants T1, T2, T3, and T4, the two curves can be several degrees apart, yet they converge as soon as the temperature stabilises.
Common sources of variation during a comparison
The normal operating cycles of a refrigerator or freezer produce regular, unavoidable temperature fluctuations: the compressor switching on and off, automatic defrost cycles, and door openings. If a comparison is made during one of these events, the observed discrepancy can be several degrees — with neither instrument at fault.
How to avoid this pitfall
For a comparison to be meaningful, you must wait for a period of thermal stability: allow the enclosure to run in steady state, with the door closed, for at least 30 minutes after any disruptive event, and only compare readings over a window of time when both curves are flat and parallel.
Key takeaway: a discrepancy observed mid-cycle (compressor running, defrost in progress, door recently opened) tells you nothing about the reliability of your instruments. Always wait for stable conditions before drawing any conclusions.
5. Probe placement: a few centimetres can mean several degrees
This is arguably the most underestimated source of discrepancy. Inside a storage enclosure, temperature is not uniform. It can vary by several degrees depending on vertical position, distance from the evaporator, proximity to the walls or door seal, and internal air circulation.
Thermal stratification
Warm air rises, cold air sinks. This stratification effect is particularly pronounced in natural-convection refrigerators (without a forced-air fan). The temperature difference between the bottom shelf and the top shelf can exceed 3 °C to 5 °C in non-ventilated units.
Air circulation and dead zones
In forced-air units, the airflow creates active zones (near the vents) and dead zones (corners, areas blocked by stored products). A data logger placed in a dead zone can read significantly higher temperatures than one placed in the main airstream.
Wall proximity and edge effects
Placing a Thermo Button directly against a metal wall or on a metal shelf rack can skew readings through thermal conduction. It is recommended to position the data logger freely in the air, suspended or resting on the products, with no direct contact with the enclosure walls.
Practical recommendation: for a HACCP audit or equipment qualification, always place the data logger at a position representative of the stored products — typically the centre of the usable volume — rather than next to the equipment’s own control probe.
6. Comparing against an external probe
Things become slightly more complex when the discrepancy is not with the equipment’s built-in display, but with an external probe — a reference thermometer, another data logger, or an instrument from a metrology laboratory.
Two instruments can legitimately disagree
Two instruments each rated at ±0.5 °C can display values differing by up to 1 °C without either being faulty. This is a direct consequence of the accumulation of measurement tolerances: if instrument A reads +3.5 °C and instrument B reads +4.3 °C, both are within their guaranteed accuracy band around the true value.
Likewise, a Thermo Button 22L (±0.5 °C) compared against a Thermo Button 21G (±1 °C) can show a discrepancy of up to 1.5 °C while both remain within specification.
The same physical factors apply
Even when comparing two calibrated digital probes, the placement, response time, and measurement frequency factors described in the preceding sections all remain relevant. Two probes placed 30 cm apart inside a poorly homogeneous refrigerator can legitimately show different temperatures, without either being faulty.
How to carry out a rigorous comparison
For a meaningful comparison between two instruments, the following conditions must be met:
- Same physical location: both sensors must have equivalent thermal contact with the same medium — ideally immersed in a thermostatic bath or homogeneous environment.
- Same measurement instant: readings must be synchronised to ensure they were both captured at the same moment.
- Stable conditions: the temperature must have been steady for long enough that both instruments have reached their equilibrium reading, accounting for their respective response times.
Best practice: if you would like to carry out an initial check yourself before sending an instrument to a laboratory, consult our practical guide below. Bear in mind that a field verification provides a useful indication, but does not carry the same evidential weight as an ISO 17025 calibration.
Related article
How to check or calibrate your temperature data logger yourself
Ice-bath method, incubator method, uncertainty calculation, and certificate writing — along with the limitations compared to laboratory calibration.
Important: a field check, however carefully conducted, is no substitute for calibration carried out by an ISO 17025-accredited metrology laboratory. In a laboratory setting, measurement conditions — thermostatic bath, standards traceable to national references, rigorous uncertainty calculation using the 5M method — provide a level of confidence and traceability that field methods cannot match. This is the service Plug and Track offers as an optional add-on.
Summary: how to make sense of a discrepancy
A discrepancy between your Plug and Track data logger and another indicator is, in the vast majority of cases, entirely normal and explainable. Here are the questions to ask systematically before concluding that something is wrong:
- Are both instruments in the same location, at the same distance from the walls and the airflow?
- Was the enclosure temperature stable at the time of the comparison (no recent defrost cycle, no door opening)?
- Does the discrepancy exceed 1 °C to 1.5 °C under stable conditions and at identical positions? If so, a metrological check is warranted.
- Has the equipment’s own display been calibrated? In the vast majority of cases, the answer is no.
If you remain uncertain, our support team is on hand to analyse your data curves and help you interpret any discrepancies.